Web-based interactive visualization of molecules
Have you ever tried opening a molecule file that you received from a colleague, or a file that you found online and ended up spending half an hour trying to make it work? Even though chemical files mostly have well-defined formats, implemenation differences between the software that reads and writes these files can cause problems. This problem is especially significant in file formats where a cell is defined in addition to atomic coordinates (e.g. crystals).
An easy and cross-platform way to visualize molecules is using web-applications. This allows you to make sure that the file you shared with your colleague would be visualized the exact same way. Or even better, you can embed the molecule in your web-page and just send a link! Here’s how you can do all that.
3DMol.js
3Dmol.js is an object-oriented, webGL based JavaScript library for online molecular visualization. It supports several formats (pdb, sdf, mol2, xyz, and cube), can show regular geometric shapes and surfaces using customizable styles.
Embedding from a file
The biggest advantage of 3DMol.js is that you can embed a molecule using a URL.
This makes things much easier to visualize molecules in a website.
You only need to upload the molecule file and provide the URL for that file.
Here is the javascript library and the HTML div element you would need for this:
<script src="https://3Dmol.csb.pitt.edu/build/3Dmol-min.js"></script>

<div style="height: 300px; width: 500px;"
  class='viewer_3Dmoljs' data-datatype='xyz'
  data-backgroundcolor='0xffffff'
  data-href='/path/to/myMolecule.xyz'
  data-style='stick'>
</div>
Decacylene
As an example you can see a decacylene
molecule visualization (embedded in markdown) using an xyz file and 3DMol.js library.
Visualizing from a database
Alternatively with 3DMol.js, you can visualize molecules from databases such as RSCB or PubChem.
1YCR
Here is an example for visualizing a protein (1YCR) from the Protein Data Bank.
Click here for more information on embedding a 3Dmol viewer.
Jupyter notebook
You can also embed an interactive 3Dmol.js viewer in a Jupyter notebook using py3Dmol, a simple IPython/Jupyter widget.
MolView
MolView is a great little website which gets pretty close to
a stand-alone molecular visualizer. You can search multiple databases, draw molecules, guess 3D stuctures,
and even perform energy minimization. Also, you can embed molecules in a web page using a HTML iframe element.
Just search your molecule, then click Tools -> Embed. Copy the HTML Code and paste it in a html file.
Here is the iframe element for decacylene:
<iframe style="width: 500px; height: 300px;" frameborder="0"
  src="https://embed.molview.org/v1/?mode=balls&cid=67448&bg=white">
</iframe>
Decacylene
Drawing and embedding a molecule
Using MolView’s user interface, you can draw a molecule with the tools on the left hand side in the 2D view.
After you finish drawing, click the 2D to 3D button on top of the molecule to render the 3D image.
This will also create a molecule id, which you can see in the address bar of your browser.
Using that id you can either use the same iframe element and change the id, or go to Tools -> Embed
to generate a new html element.
For example, caffeine’s id is 2519. By using the same iframe element as decacylene and changing the
cid=67448 to cid=2519 you can generate a new embed:
<iframe style="width: 500px; height: 300px;" frameborder="0"
  src="https://embed.molview.org/v1/?mode=balls&cid=2519&bg=white">
</iframe>
which looks like:
Visualizing from a database
MolView makes it really easy to visualize entries from databases. You can search through the databases or use specific id numbers to visualize entries. Here are the main databases supported by MolView:
- PubChem Compounds (~51 million compounds)
- RSCB Protein Data Bank (~100.000 macromolecules)
- Crystallography Open Database (~300.000 crystals)
- NIST Chemistry WebBook (~30.000 spectra)
Diamond from the Crystallography Open Database
By using the id of diamond from Crystallography Open Database (COD) and using the following HTML iframe
element, crystal structures can also be visualized. Note that here the link has codid=9012304
because we are using the Crystallography Open Database.
<iframe style="width: 500px; height: 300px;" frameborder="0"
  src="https://embed.molview.org/v1/?mode=balls&codid=9012304&bg=white">
</iframe>
NGLview
NGLview is a great visualizer with many options and has a very active development team on GitHub. It has a great Python library which allows you to visualize molecules and trajectories in Jupyter notebooks!
Jupyter notebook
NGLview allows beautiful visualization of molecules embedded in Jupyter notebook:

Using the Python library, you can create html files for molecules/trajectories which you can visualize using a browser:

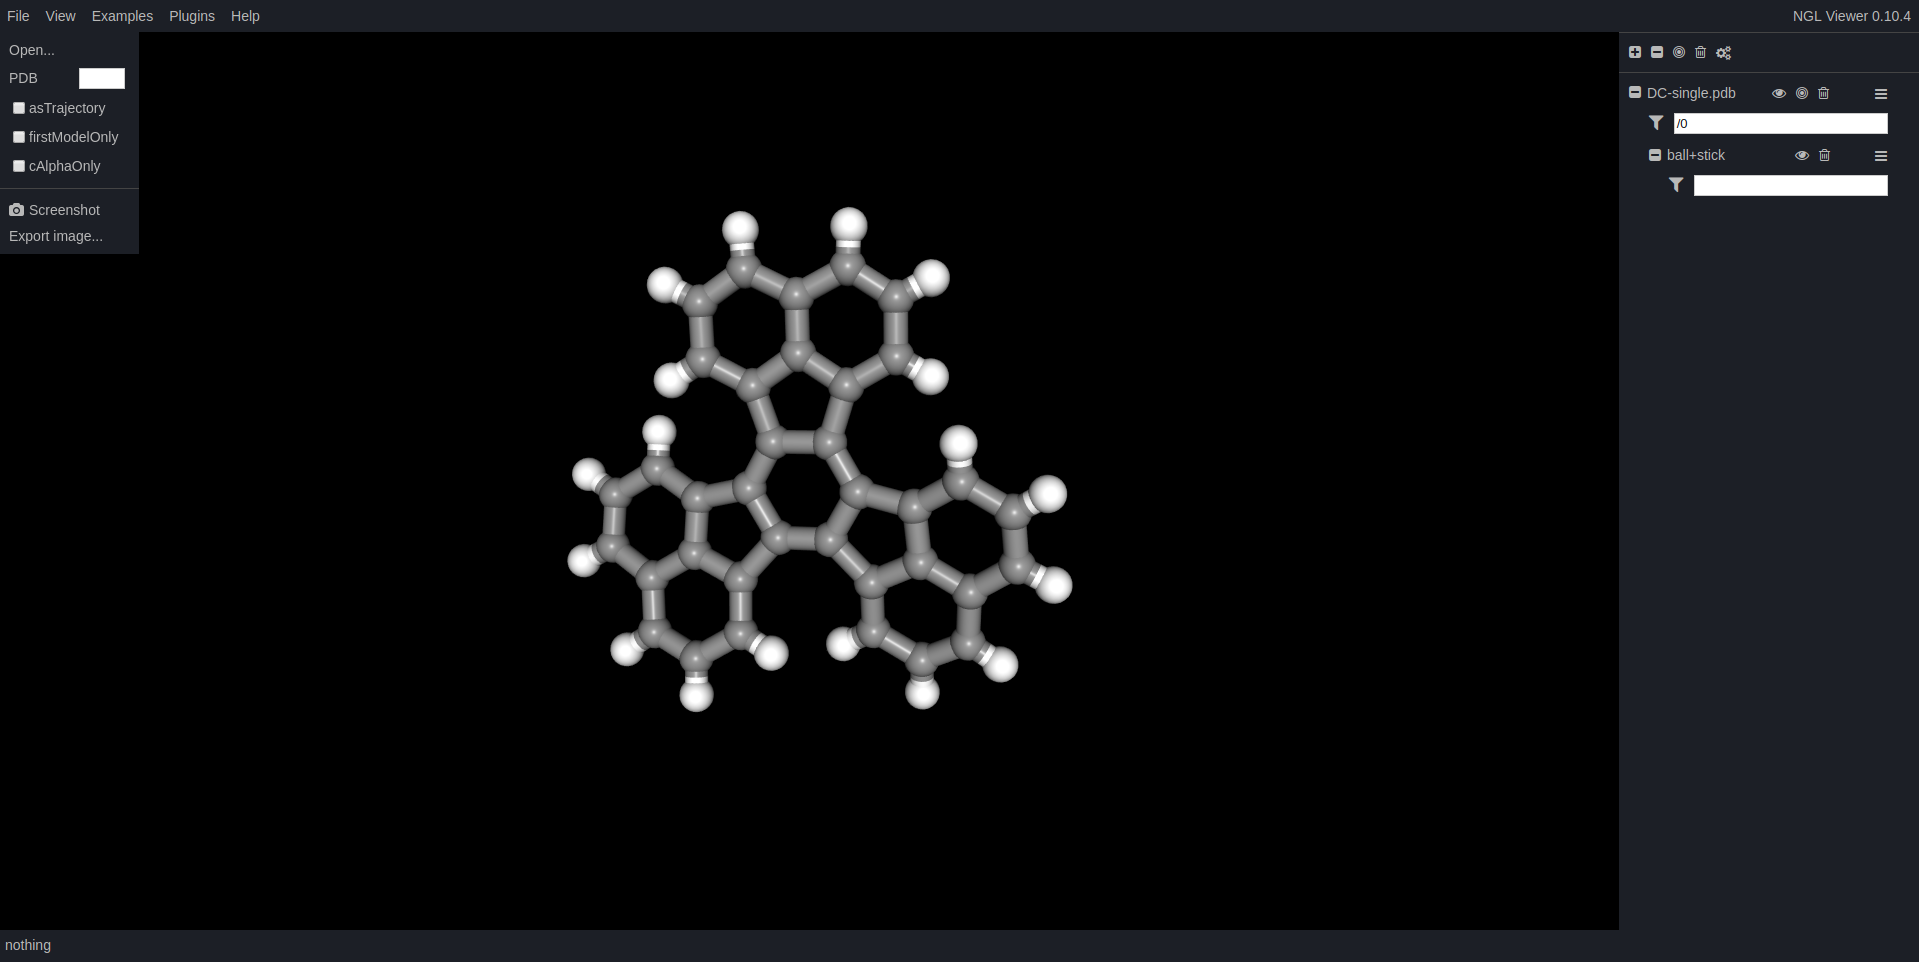
Online visualizer
Also, it has an online visualizer which allows you to upload molecules from your computer. Here, give it a try:
Three.js
Three.js is a cross-browser JavaScript library/API used to create and display animated 3D computer graphics in a web browser. It’s fairly powerful and you can create neat animations using a little javascript. Definitely checkout the featured projects. Three.js has a built-in PDBLoader which you can use to load molecules.
Alternatively, you can use the atomVis template I created. The template allows you to visualize a molecule locally, without running a web server. However, this means that you need to convert your molecule file into a javascript file in order to visualize it as browsers don’t allow reading of regular local files for security reasons. Take a look at the code and let me know if you have any questions/suggestions.
If you know other web-based methods for visualizing molecules please feel free to contribute/comment!